---
title: "Cross-Validation (Notes)"
subtitle: "Stat 253"
author: "Your Name"
format:
html:
toc: true
toc-depth: 2
embed-resources: true
---
```{r setup}
#| include: false
knitr::opts_chunk$set(
collapse = TRUE,
warning = FALSE,
message = FALSE,
error = TRUE,
fig.height = 2.75,
fig.width = 4.25,
fig.env='figure',
fig.pos = 'h',
fig.align = 'center')
```
# Learning Goals {.unnumbered .smaller}
- Accurately describe all steps of cross-validation to estimate the test/out-of-sample version of a model evaluation metric
- Explain what role CV has in a predictive modeling analysis and its connection to overfitting
- Explain the pros/cons of higher vs. lower k in k-fold CV in terms of sample size and computing time
- Implement cross-validation in R using the `tidymodels` package
- Use these tools and concepts to inform and justify data analysis and modeling process
\
\
# Notes: Cross-Validation {-}
## Context: Evaluating Regression Models {.unnumbered .smaller}
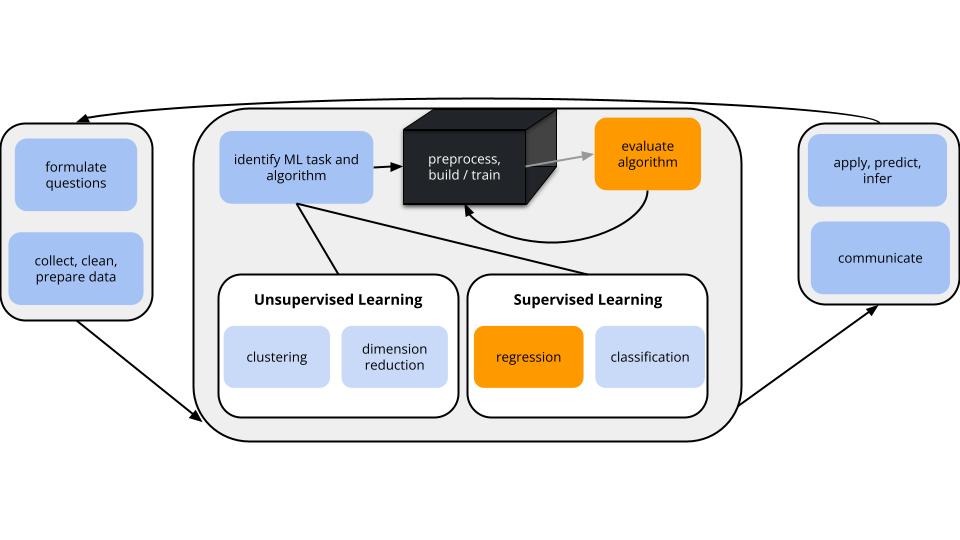
A reminder of our current context:
{width=100%}
- **world = supervised learning**
We want to model some output variable $y$ by some predictors $x$.
- **task = regression**
$y$ is quantitative
- **model = linear regression model via least squares algorithm**
We'll assume that the relationship between $y$ and $x$ can be represented by
$$y = \beta_0 + \beta_1 x_1 + \beta_2 x_2 + ... + \beta_p x_p + \varepsilon$$
**GOAL: model evaluation**
We want more **honest** metrics of prediction quality that
(1) assess how well our model predicts **new outcomes**; and
(2) help prevent [**overfitting**](L03-overfitting.html#overfitting).
\
{width=400px}
\
## Why is overfitting so bad? {.unnumbered .smaller}
Not only can overfitting produce misleading models, it can have serious societal impacts.
Examples:
::: {.incremental}
- Facial recognition algorithms are often _overfit_ to the people who build them (who are not broadly representative of society). As one example, this has led to [disproportionate bias in policing](https://www.nytimes.com/2019/07/08/us/detroit-facial-recognition-cameras.html). For more on this topic, you might check out [Coded Bias](https://www.youtube.com/watch?v=jZl55PsfZJQ), a documentary by Shalini Kantayya which features MIT Media Lab researcher Joy Buolamwini.
- Polygenic risk scores (PRSs), which aim to predict a person's risk of developing a particular disease/trait
based on their genetics, are often _overfit_ to the data on which they are built (which, historically,
has exclusively---or at least primarily---included individuals of European ancestry).
As a result, PRS predictions tend to be more accurate in European populations and new
research suggests that their [continued use in clinical settings could exacerbate health disparities](https://www.ncbi.nlm.nih.gov/pmc/articles/PMC6563838/).
- There are connections to overfitting in the article for the ethics reflection on HW1 (about [a former Amazon recruiting algorithm](https://www.reuters.com/article/us-amazon-com-jobs-automation-insight/amazon-scraps-secret-ai-recruiting-tool-that-showed-bias-against-women-idUSKCN1MK08G).
:::
\
## k-Fold Cross Validation {.unnumbered .smaller}
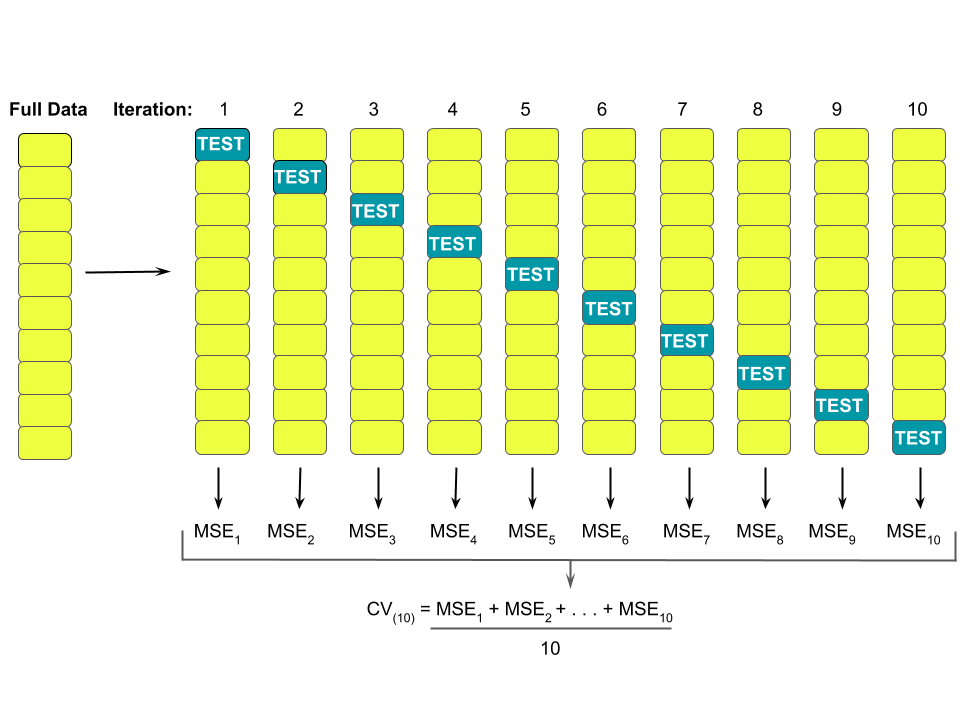
We can use **k-fold cross-validation** to estimate the typical error in our model predictions for *new* data:
::: incremental
- Divide the data into $k$ folds (or groups) of approximately equal size.\
- Repeat the following procedures for each fold $j = 1,2,...,k$:
- Remove fold $j$ from the data set.\
- Fit a model using the data in the other $k-1$ folds (training).\
- Use this model to predict the responses for the $n_j$ cases in fold $j$: $\hat{y}_1, ..., \hat{y}_{n_j}$.\
- Calculate the MAE for fold $j$ (testing): $\text{MAE}_j = \frac{1}{n_j}\sum_{i=1}^{n_j} |y_i - \hat{y}_i|$.
- Combine this information into one measure of model quality: $$\text{CV}_{(k)} = \frac{1}{k} \sum_{j=1}^k \text{MAE}_j$$
:::
{width=100%}
\
\
# Small Group Discussion {-}
Algorithms and Tuning
## Definitions {.unnumbered .smaller}
- **algorithm** = a step-by-step procedure for solving a problem (Merriam-Webster)
- **tuning parameter** = a *parameter* or *quantity* upon which an algorithm depends, that must be *selected* or *tuned* to "optimize" the algorithm
{width=250px}^[https://www.wallpaperflare.com/grayscale-photography-of-guitar-headstock-music-low-electric-bass-wallpaper-zzbyn]
{width=250px}
## Prompts {.unnumbered .smaller}
1. **Acting out 3-fold cross-validation**
- Break into roles:
- 3 students will be the **code** (you will be algorithm overseers and direct the remainder of your classmates).
- Everyone else will be the **data**.
- *Everyone* should feel free to share their thoughts on how to act out this CV process.
- Modeling context:
- We are evaluating a predictive model for **height**.
- The instructor will give out results for model fitting when you get to the relevant part in acting out the 3-fold CV process.
- *Your actual heights* are the response variable of interest.
2. **Conceptual check**
a. Why is $k$-fold cross-validation an *algorithm*?
b. What is the *tuning parameter* of this algorithm and what values can this take?
c. How is 2-fold cross-validation (CV) different from *validation*? (*Validation* is what we did last class: splitting our sample into a training dataset and a testing dataset.)
d. Why might 3-fold CV be better than 2-fold CV?
e. Why might LOOCV (leave-one-out CV) (k-fold CV where k = sample size) be worse than 3-fold cross-validation?
f. Make a guess: what value of k do you think practitioners typically use?
3. **R Code Preview**
We've been doing a 2-step process to build **linear regression models** using the **tidymodels** package:
```{r eval = FALSE}
# STEP 1: model specification
lm_spec <- linear_reg() %>%
set_mode("regression") %>%
set_engine("lm")
# STEP 2: model estimation
my_model <- lm_spec %>%
fit(
y ~ x1 + x2,
data = sample_data
)
```
For k-fold cross-validation, we can *tweak* STEP 2.
Discuss the code below:
- What's similar? What's different?
- What do you think each new, or otherwise modified, line does?
- Why do we need `set.seed`?
```{r eval = FALSE}
# k-fold cross-validation
set.seed(___)
my_model_cv <- lm_spec %>%
fit_resamples(
y ~ x1 + x2,
resamples = vfold_cv(sample_data, v = ___),
metrics = metric_set(mae, rsq)
)
```
\
\
# Notes: R Code {.unnumbered}
:::{.callout-note title="Reminder"}
This section is for **future** reference.
It is a summary of code you'll learn below for doing k-fold cross-validation.
You do not need to (and in fact should not) run the code in this section verbatim in R; it is example code and meant for future reference only.
:::
-------------------------------------------------
Suppose we wish to build and evaluate a linear regression model of `y` vs `x1` and `x2` using our `sample_data`.
**Load the appropriate packages**
```{r eval = FALSE}
# Load packages
library(tidyverse)
library(tidymodels)
```
**Obtain k-fold cross-validated estimates of MAE and $R^2$**
(Review above for discussion of these steps.)
```{r eval = FALSE}
# model specification
lm_spec <- linear_reg() %>%
set_mode("regression") %>%
set_engine("lm")
# k-fold cross-validation
# For "v", put your number of folds k
set.seed(___)
model_cv <- lm_spec %>%
fit_resamples(
y ~ x1 + x2,
resamples = vfold_cv(sample_data, v = ___),
metrics = metric_set(mae, rsq)
)
```
**Obtain the cross-validated metrics**
```{r eval = FALSE}
model_cv %>%
collect_metrics()
```
**Get the MAE and R-squared for each test fold**
```{r eval = FALSE}
# MAE for each test fold: Model 1
model_cv %>%
unnest(.metrics)
```
\
\
# Exercises {-}
## Instructions {.unnumbered .smaller}
::: {.incremental}
- Go to the Course Schedule and find the QMD template for today
- Save this in your STAT 253 Notes folder, NOT your downloads!
- Work through the exercises implementing CV to compare two possible models predicting `height`
- Same directions as before:
- Be kind to yourself/each other
- **Collaborate**
- DON'T edit starter code (i.e., code with blanks `___`). Instead, copy-paste
into a new code chunk below and edit from there.
- Ask me questions as I move around the room
:::
\
## Questions {.unnumbered .smaller}
```{r message = FALSE, warning = FALSE}
# Load packages and data
library(tidyverse)
library(tidymodels)
humans <- read.csv("https://Mac-Stat.github.io/data/bodyfat50.csv") %>%
filter(ankle < 30) %>%
rename(body_fat = fatSiri)
```
\
1. **Review: In-sample metrics**
Use the `humans` data to build two separate models of `height`:
```{r eval = FALSE}
# STEP 1: model specification
lm_spec <- ___() %>%
set_mode(___) %>%
set_engine(___)
```
```{r}
```
```{r eval = FALSE}
# STEP 2: model estimation
model_1 <- ___ %>%
___(height ~ hip + weight + thigh + knee + ankle, data = humans)
model_2 <- ___ %>%
___(height ~ chest * age * weight * body_fat + abdomen + hip + thigh + knee + ankle + biceps + forearm + wrist, data = humans)
```
```{r}
```
Calculate the **in-sample** R-squared for both models:
```{r eval = FALSE}
# IN-SAMPLE R^2 for model_1 = ???
model_1 %>%
___()
```
```{r}
```
```{r eval = FALSE}
# IN-SAMPLE R^2 for model_2 = ???
model_2 %>%
___()
```
```{r}
```
Calculate the **in-sample** MAE for both models:
```{r eval = FALSE}
# IN-SAMPLE MAE for model_1 = ???
model_1 %>%
___(new_data = ___) %>%
mae(truth = ___, estimate = ___)
```
```{r}
```
```{r eval = FALSE}
# IN-SAMPLE MAE for model_2 = ???
model_2 %>%
___(new_data = ___) %>%
mae(truth = ___, estimate = ___)
```
```{r}
```
\
2. **In-sample model comparison**
Which model seems "better" by the in-sample metrics you calculated above?
Any concerns about either of these models?
\
3. **10-fold CV**
Complete the code to run 10-fold cross-validation for our two models.
Model 1: `height ~ hip + weight + thigh + knee + ankle`
Model 2: `height ~ chest * age * weight * body_fat + abdomen + hip + thigh + knee + ankle + biceps + forearm + wrist`
```{r eval = FALSE}
# 10-fold cross-validation for model_1
set.seed(253)
model_1_cv <- ___ %>%
___(
___,
___ = vfold_cv(___, v = ___),
___ = metric_set(mae, rsq)
)
```
```{r}
```
```{r eval = FALSE}
# 10-fold cross-validation for model_2
set.seed(253)
model_2_cv <- ___ %>%
___(
___,
___ = vfold_cv(___, v = ___),
___ = metric_set(mae, rsq)
)
```
```{r}
```
\
4. **Calculating the CV MAE**
a. Use `collect_metrics()` to obtain the cross-validated MAE and $R^2$ for both models.
```{r eval = FALSE}
# HINT
___ %>%
collect_metrics()
```
```{r}
```
b. Interpret the cross-validated MAE *and* $R^2$ for `model_1`.
\
5. **Details: fold-by-fold results**
The `collect_metrics()` function gave the final CV MAE, or the average MAE across all 10 test folds.
If you want the MAE from *each* test fold, try `unnest(.metrics)`.
a. Obtain the fold-by-fold results for the `model_1` cross-validation procedure using `unnest(.metrics)`.
```{r eval = FALSE}
# HINT
___ %>%
unnest(.metrics)
```
```{r}
```
b. Which fold had the worst average prediction error and what was it?
c. Recall that `collect_metrics()` reported a final CV MAE of 1.87 for `model_1`. Confirm this calculation by wrangling the fold-by-fold results from part a.
```{r}
```
\
6. **Comparing models**
The table below summarizes the in-sample and 10-fold CV MAE for both models.
Model IN-SAMPLE MAE 10-fold CV MAE
----------- -------------- ---------------
`model_1` 1.55 1.87
`model_2` 0.64 2.47
a. Based on the in-sample MAE alone, which model appears better?
b. Based on the CV MAE alone, which model appears better?
c. Based on all of these results, which model would you pick?
d. Do the in-sample and CV MAE suggest that `model_1` is overfit to our `humans` sample data? What about `model_2`? Why/why not?
\
7. **LOOCV**
No code to implement for this exercise--just answer the following conceptually.
a. How could we adapt the code in Exercise 3 to use LOOCV MAE instead of the 10-fold CV MAE?
b. Why do we technically not *need* to `set.seed()` for the LOOCV algorithm?
\
8. **Data drill**
a. Calculate the average height of people under 40 years old vs people 40+ years old.
```{r}
```
b. Plot height vs age among our subjects that are 30+ years old.
```{r}
```
c. Fix this code:
```{r eval = FALSE}
model_3<-lm_spec%>%fit(height~age,data=humans)
model_3%>%tidy()
```
```{r}
```
\
9. **Reflection: Part 1**
The "regular" exercises are over, but class is not done!
Your group should agree to either work on HW1 or the remaining reflection questions.
_This is the end of Unit 1 on "Regression: Model Evaluation"!_
Let's reflect on the technical content of this unit:
- What was the main motivation / goal behind this unit?
- What are the four main questions that were important to this unit?
- For each of the following tools, describe how they work and what questions they help us address:
- R-squared
- residual plots
- out-of-sample MAE
- in-sample MAE
- validation
- cross-validation
- In your own words, define the following:
- overfitting
- algorithm
- tuning parameter
- Review the new `tidymodels` syntax from this unit. Identify key themes and patterns.
**Just for fun--icons!** You may have noticed that the left sidebar of our course website has icons for the top few pages. It would be nice to have icons for our main content activities too!
- Go to https://icons.getbootstrap.com/ to browse the icons that are available.
- Find an icon that is emblematic of the main content/ideas for each of our first 4 topics (Introductions & Overview, Model Evaluation, Overfitting, Cross-Validation).
# Done!
- Render your notes.
- Check the solutions in the course website (Solution drop downs).
- If you finish all that during class, start your homework!