Cohort studies
Learning goals
After this lesson, you should be able to:
- Explain the rationale for how cohort studies help us study the link between exposures and disease outcomes.
- Describe the difference between measuring the strength of association between exposure and disease versus impact of exposure on disease risk.
- Compute and interpret a relative risk from study data.
- Compute and interpret an attributable risk (AR) and a population attributable risk (PAR) from study data.
Recap of video material
Observational vs. experimental
Observational studies
- Cohort studies (this week)
- Case-control studies (next week)
- Ecological studies (this week)
Experimental studies
- Randomized experiments (after Spring Break)
Ecological studies
Ecological studies, like cohort studies, are a type of observational study. In these studies, the unit of observation is an aggregate (e.g., state, country) rather than an individual person.
The following figure from this article shows an example of an ecological study. The unit of observation is a country, and on each country, we have data on breast cancer incidence and average dietary fat consumption.
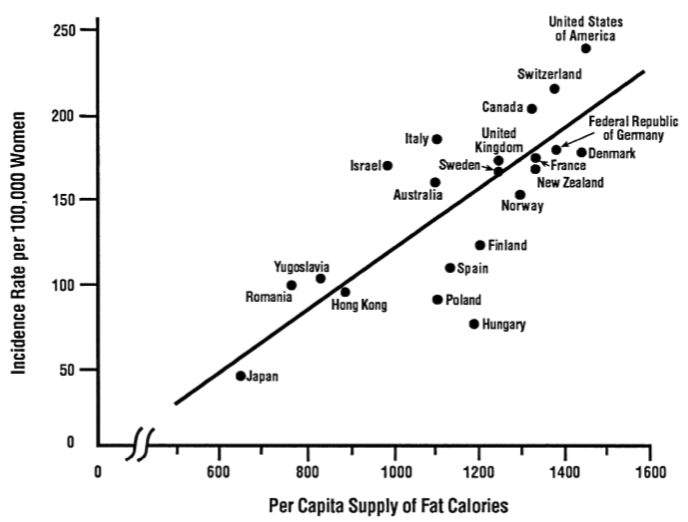
- What we do learn from this study: There seems to be a relationship between breast cancer incidence and average fat consumption at the country level.
- What we do not learn: We do not learn whether there is a relationship between breast cancer incidence and average fat consumption at the individual level. That is, we do not learn that an individual is more likely to develop breast cancer if they eat more fat.
The ecological fallacy is a term that describes the idea that a conclusion on aggregate data does not necessarily transfer to individuals.
Let’s look at one more example. A New England Journal of Medicine study looked at the relationship between chocolate consumption and cognitive function by using country-level data:
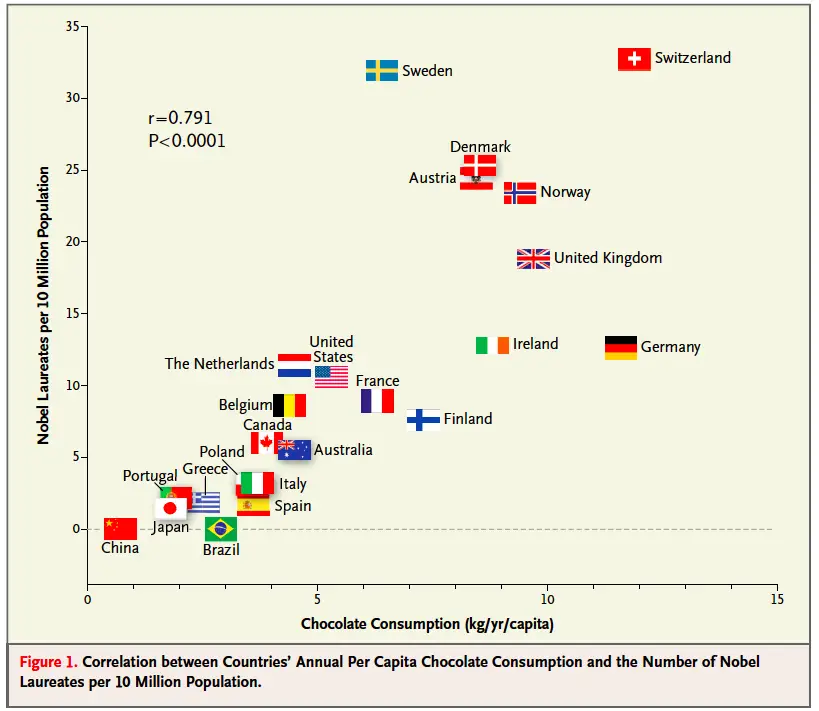
We’ll think more on this study in our exercises.
Cohort studies
Study design
Unlike ecological studies, cohort studies obtain data on individuals.
- Contextual knowledge leads investigators to explore a particular exposure. Even though exposure has the connotation of a harmful exposure, the exposure studied could be a beneficial exposure, like a treatment.
- Once we have identified individuals who were exposed and unexposed, we follow them over time to collect incidence data.
- This can be done prospectively (actually following forward in time) or retrospectively (looking back historically at an earlier time point and following time forward to the present).
Using data to make comparisons
Cohort study data allows us to compare incidence between the exposed () and unexposed ().
Ratios:
- Relative risk:
- It measures how strongly associated exposure and disease are.
- Interpretation: If RR = 2, we say that the exposed group is 2 times as likely to experience the outcome as the unexposed group.
Differences:
- Attributable risk in the exposed (AR):
- This measures impact of exposure (or excess risk) in exposed individuals. If we could have removed the exposure for people who were exposed, how much disease could we prevent?
- Interpretation: If AR = 130 cases/100,000 people, we interpret this AR as “If there were 100,000 fewer exposures, we would expect to see 130 fewer disease cases.”
- Attributable risk in the population (PAR):
- This measures the impact of exposure in a population. If we could remove an exposure for an entire population, how much disease could we prevent?
- Interpretation: If PAR = 90 cases/100,000 people, we interpret this AR as “If we eliminated the exposure across the entire population, we would expect to see 90 fewer disease cases per 100,000 people.”
- Note: PAR will be between 0 and AR.
- The extreme of 0 represents the impact if no one in the population is exposed.
- The extreme of AR represents the impact if everyone in the population is exposed.
- We can also see that PAR is between 0 and AR from the fact that because exposure prevalence is between 0 and 1.
Activity
Navigate to Moodle, and open the PDF titled 05_cohort_studies_activity.
Article discussion
We’ll explore the details of the article Association of Stillbirth With Ambient Air Pollution in a California Cohort Study through the following discussion questions:
In the abstract, the authors mention that they use a “retrospective cohort design.” Based on what you read in the Methods section, how do you think a retrospective cohort study is carried out in general? What could be one advantage of this study design?
What concerns might we have about the quality/accuracy of different pieces of data in this study?
We’ve used 2x2 tables to summarize information from cohort studies. What do you think such a table would like for this study?
In the Discussion, the authors discuss their inability to look at the role of smoking in stillbirth risk. They are not overly concerned, for they state: “Previous studies of other birth outcomes conducted in California and nationally have not seen shifts in air pollution associations after adjustment for smoking.” Describe how concepts from direct standardization apply here.