.jpg)
# Load the data
data(bechdel)Practice Problems 1
Purpose
The goal of this set of practice problems is to practice the following skills:
- Constructing and interpreting visualizations that inform research questions of interest
- Data wrangling
- Constructing and interpreting simple linear regression models
You can download a template to start from here.
Directions
We will be using data from the
fivethirtyeightpackage. Install this package by entering theinstall.packages()command in the Console. (Do not include the installation command in this file–your document won’t render to the required HTML file!)Create a code chunk in which you load the
ggplot2,dplyr, andfivethirtyeightpackages.Continue with the exercises below. You will need to create new code chunks to construct visualizations and models and write interpretations beneath. Put text responses in blockquotes as shown below:
Response here. (The > at the start of the line starts a blockquote and makes the text larger and easier to read.)
- Render your work for submission:
- Click the “Render” button in the menu bar for this pane (blue arrow pointing right). This will create an HTML file containing all of the directions, code, and responses from this activity. A preview of the HTML will appear in the browser.
- Scroll through and inspect the document to check that your work translated to the HTML format correctly.
- Close the browser tab.
- Go to the “Background Jobs” pane in RStudio and click the Stop button to end the rendering process.
- Locate the rendered HTML file in the folder where this file is saved. Open the HTML to ensure that your work looks as it should (code appears, output displays, interpretations appear). Upload this HTML file to Moodle.
Exercises
Context
This cartoon by Alison Bechdel inspired the “Bechdel test” (image source):
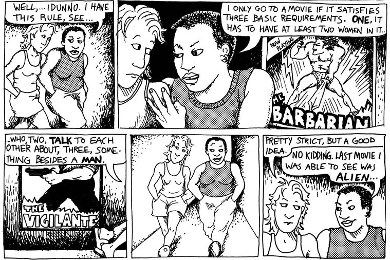
A movie passes the test if it meets the following criteria:
- there are at least 2 women-identifying characters;
- these characters talk to each other at least 1 time; and
- they talk about something other than a male-identifying character
We’ll work with the bechdel data within the fivethirtyeight package. You can enter ?bechdel in the Console to view the codebook.
Exercise 1: Define two new variables
We can use the mutate() function from dplyr to define new variables. For example:
# Define a new variable which measures years_since_1900
bechdel <- bechdel %>%
    mutate(years_since_1900 = year - 1900)

# Check it out / confirm it's right
bechdel %>%
    select(year, years_since_1900) %>%
    head(3)
Your turn. Define a new variable budget_mil which measures budget in MILLIONS of dollars (on the 2013 scale). Similarly, define a new variable intgross_mil which measures international gross in MILLIONS of dollars (on the 2013 scale). Store these in bechdel and confirm your results match those here:
## # A tibble: 3 x 2
##   budget_mil intgross_mil
##        <dbl>        <dbl>
## 1       13           42.2
## 2       45.7         41.5
## 3       20          159.
Exercise 2: Get to know the data
Complete each task below using dim(), nrow(), head(), or one of the dplyr functions: filter(), summarize(), select(). For any questions about movie budget and gross earnings, use budget_mil and gross_mil. NOTE: You don’t need to write out any discussion for this exercise, just include your code and output.
# How many films are in the dataset?

# When was the oldest film in the dataset made?

# When was the most recent film in the dataset made?

# What is the median film budget in 2013 dollars?

# What films had budgets that exceeded 300 million in 2013 dollars?
# (Just show the films and budgets, not all variables)

# What films were made in 1971?
# (Just show the films and year, not all variables)

# What were the budget_mil and intgross_mil values for "Titanic"?
# (Just show the budget_mil and intgross_mil values)
Exercise 3: Does it pass the Bechdel?
The clean_test variable records the Bechdel category into which each movie falls. From worst to best (if you care about the representation of women in film):
nowomen= there are no significant women characters in the filmnotalk= there are women characters but they don’t talk to one anothermen= there are women characters that talk to one another but they only talk about mendubious= barely passes the Bechdel testok= passes the Bechdel test
Construct a visualization of the clean_test variable, and construct a corresponding table of counts. In one sentence, summarize your findings about clean_test as if you were writing a newspaper article about movies.
Exercise 4: How much money did it make?
The intgross_mil variable records each movie’s total international gross, in millions of dollars (and adjusted to 2013).
Construct a visualization of the
intgross_milvariable. Summarize your findings as if you were writing a newspaper article about movies.Calculate the mean and median values of
intgross_mil. Explain why the mean exceeds the median by quite a bit and which is the more appropriate measure of trend here.- NOTE: Since some films are missing information on
intgross_mil, you’ll need to usemean(___, na.rm = TRUE)wherena.rm = TRUEsays to remove the NA (missing) values from the calculation. Similarly for the median.
- NOTE: Since some films are missing information on
Calculate the standard deviations for the
intgross_milandbudget_milvariables. Comment on whether there’s more variability among how much money is spent making movies (budgets) or how much money a movie makes (grosses)?
Exercise 5: Explaining intgross_mil
Next, let’s try to explain some of the variability in how much money films gross. To this end, we’ll focus on modeling intgross_mil by budget_mil. That is, to what extent is the money a film makes related to its budget?
In the relationship between
intgross_milandbudget_mil, which is the response variable?Construct a visualization of the relationship between
intgross_milandbudget_mil. Include a regression line that represents the trend in this relationship.In 1-3 sentences, summarize your findings about this relationship as if you were writing a newspaper article about movies. Be sure to comment on both the trend and variability in this relationship.
Exercise 6: Modeling intgross_mil
Let’s examine the relationship between intgross_mil and budget_mil in more detail.
Use
lm()to construct a linear regression model of the trend in the relationship betweenintgross_milandbudget_mil. Store this asmovie_modeland report a model summary table.Write out a formula for the trend.
Provide a newspaper appropriate interpretation of the
budget_milcoefficient. Make sure to use non-causal language, include units, and talk about averages rather than individual cases.Does it make sense to interpret the intercept in this model? Explain.
Exercise 7: Predictions and residuals
- In exercise 2 you identified the budget (
budget_mil) for the movie Titanic. Use the model formula above to predict its international gross. You can check your work using thepredict()function. This provides a more accurate prediction (it doesn’t round the model coefficients) so don’t worry if your calculation doesn’t exactly match.
predict(___, newdata = data.frame(budget_mil = ___))Calculate the Titanic residual. HINT: You’ll need to use the observed
intgross_milvalue from exercise 2.Based on your calculation in part b, did the model over- or under-estimate Titanic’s gross?