Topic 15 Causal Discovery
Learning Goals
DISC1: Demonstrate conceptual understanding of causal discovery by reasoning about outputs of the process and by manually conducting it using regression models.DISC2: Use output from causal discovery to enhance a causal analysis as part of a sensitivity analysis.

Exercises
You can download a template RMarkdown file to start from here.
Exercise 1
There are two genes (Gene A and Gene B) that produce Protein X. Gene A is the primary producer. Whenever Gene A is functional, Gene B is inactive and produces nothing. However, if Gene A loses function, Gene B becomes active and produces Protein X in Gene A’s place in exactly the same amounts.
Draw the DAG implied by this expert knowledge.
We can view Gene A as a binary variable with values “functional” and “non-functional”. Will Gene A and Protein X be marginally independent or marginally dependent in the data? Explain.
Discuss your answers to (a) and (b) in the context of a relevant concept.
Exercise 2
In this exercise, we’ll think about the conditional independence test and the role of the hypothesis testing significance level as a tuning parameter.
As the significance level is lowered to 0, what would you expect to happen to the graph skeleton learned by causal discovery algorithms? As the significance level is increased to 1? Explain.
Exercise 3
Consider data that truly come from a chain X -> Y -> Z. What pattern would a causal discovery algorithm report?
It is possible to supply causal discovery algorithms with prior knowledge - for example, specific edges that are required to be present. If you could supply prior knowledge to the algorithm on only one edge that is required to be present, what edge (if any) would allow the entire structure to be learned? Explain briefly.
Exercise 4
Consider data that truly come from a fork X <- Y -> Z. What pattern would a causal discovery algorithm report?
If you could supply prior knowledge to the algorithm on only one edge that is required to be present, what edge (if any) would allow the entire structure to be learned? Explain briefly.
Exercise 5
We have learned the following structure from the skeleton building phase.
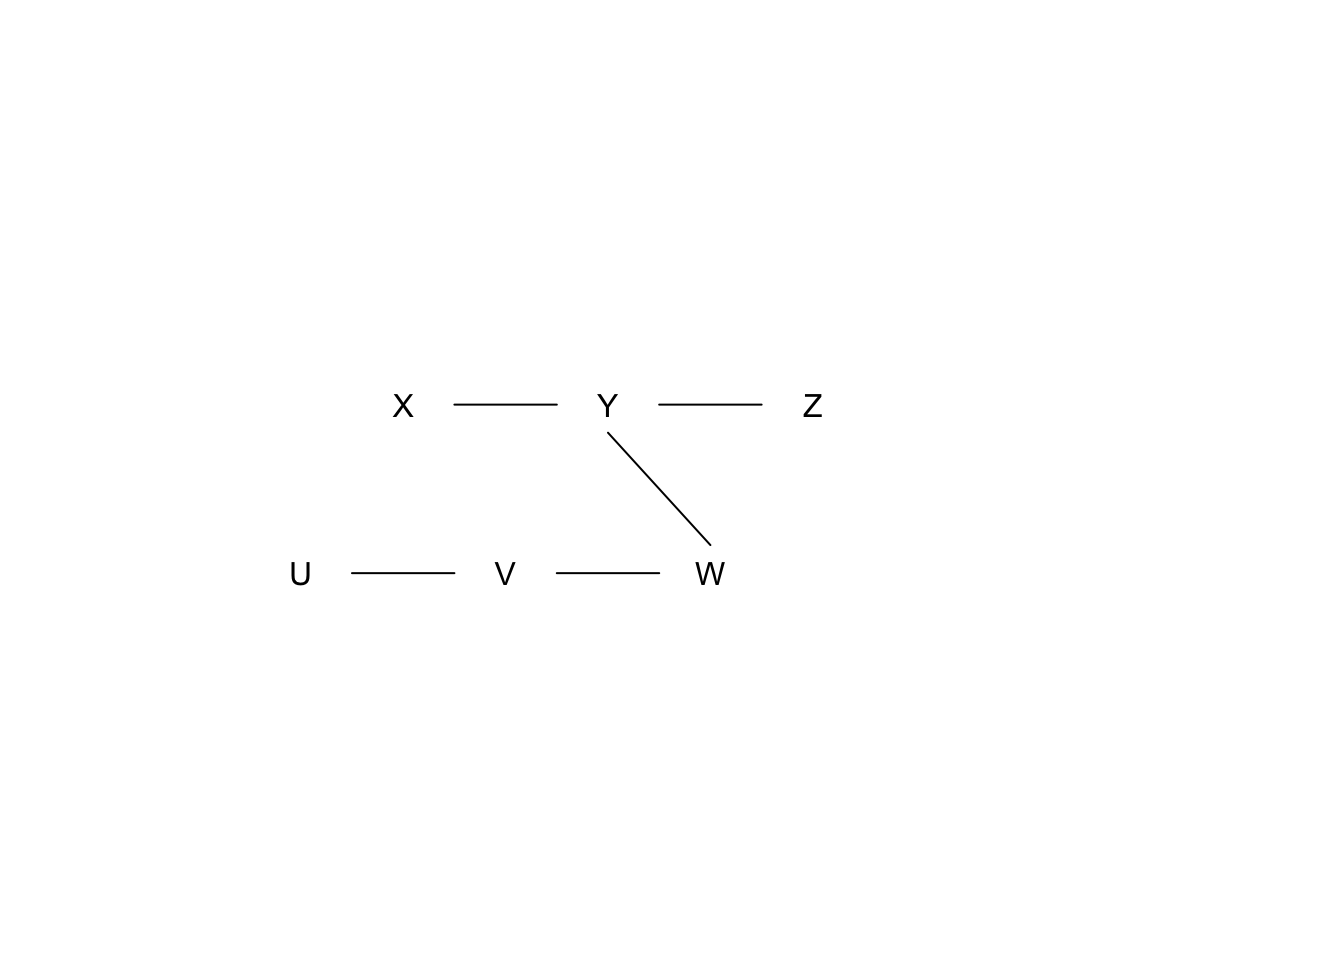
We have the following results from conditional independence tests (\(H_0\) indicates conditional independence, significance level = 0.01):
- \(X \perp\!\!\!\perp Z \mid Y\)? p-value = 0.001
- \(X \perp\!\!\!\perp W \mid Y\)? p-value = 0.1
- \(Y \perp\!\!\!\perp V \mid W\)? p-value = 0.1
- \(U \perp\!\!\!\perp W \mid V\)? p-value = 0.1
What pattern would a causal discovery algorithm report? Show your work.
Exercise 6
We have measured 3 variables \(X\), \(Y\), and \(Z\) (all quantitative). You can read in the data below.
disc_data <- readr::read_csv("https://www.dropbox.com/s/moj3k3fed7puicr/discovery_data.csv?dl=1")- Step through the causal discovery process, using regression models as your conditional independence test. Use a type 1 error rate (significance level) of \(\alpha=0.01\). Show all work. This involves:
- Showing model output.
- Writing a sentence using numbers from the output at each step to show the decisions made by the algorithm.
- Report the final output that the discovery algorithm would give.
Exercise 7
Clearly describe how causal discovery could be used as a sensitivity analysis for a regression or IP weighting analysis for estimating causal effects.