Topic 3 Overfitting
Learning Goals
- Explain why training/in-sample model evaluation metrics can provide a misleading view of true test/out-of-sample performance
Slides from today are available here.
Exercises
Exercise 1
Consider the following relationship. (From the code, we can tell that the true relationship between x and y is quadratic: \(y=x^2\) is the underlying relationship.)
Imagine a model that is overfit to this training data. (You are not limited to lines.) Draw a picture of the predictions from this overfit model.
Explain why your picture demonstrates overfitting:
- How does your model perform on the training data (the data displayed here)?
- If we received a new dataset from this same setting (test data), what would a plot of
yvs.xlook like? - How would your model perform on this new test data?
set.seed(123)

data_train <- tibble::tibble(
    x = runif(15,0,7), # Generate random numbers for predictor x
    y = x^2 + rnorm(15,sd = 7) # Generate y using y = x^2 + noise
)
data_train %>%
    ggplot(aes(x = x, y = y)) +
    geom_point() +
    theme_classic()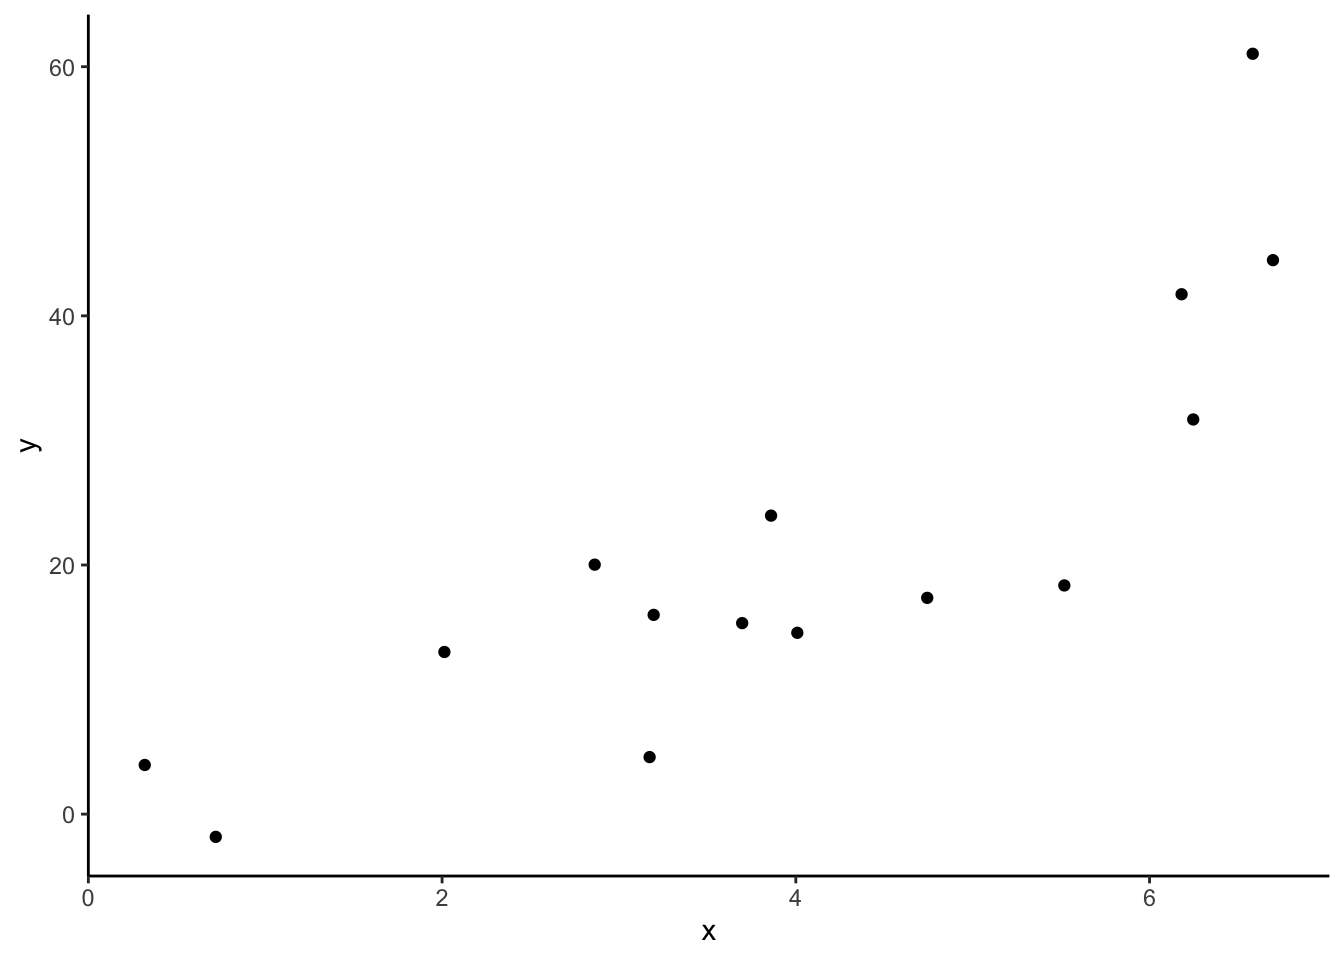
Exercise 2
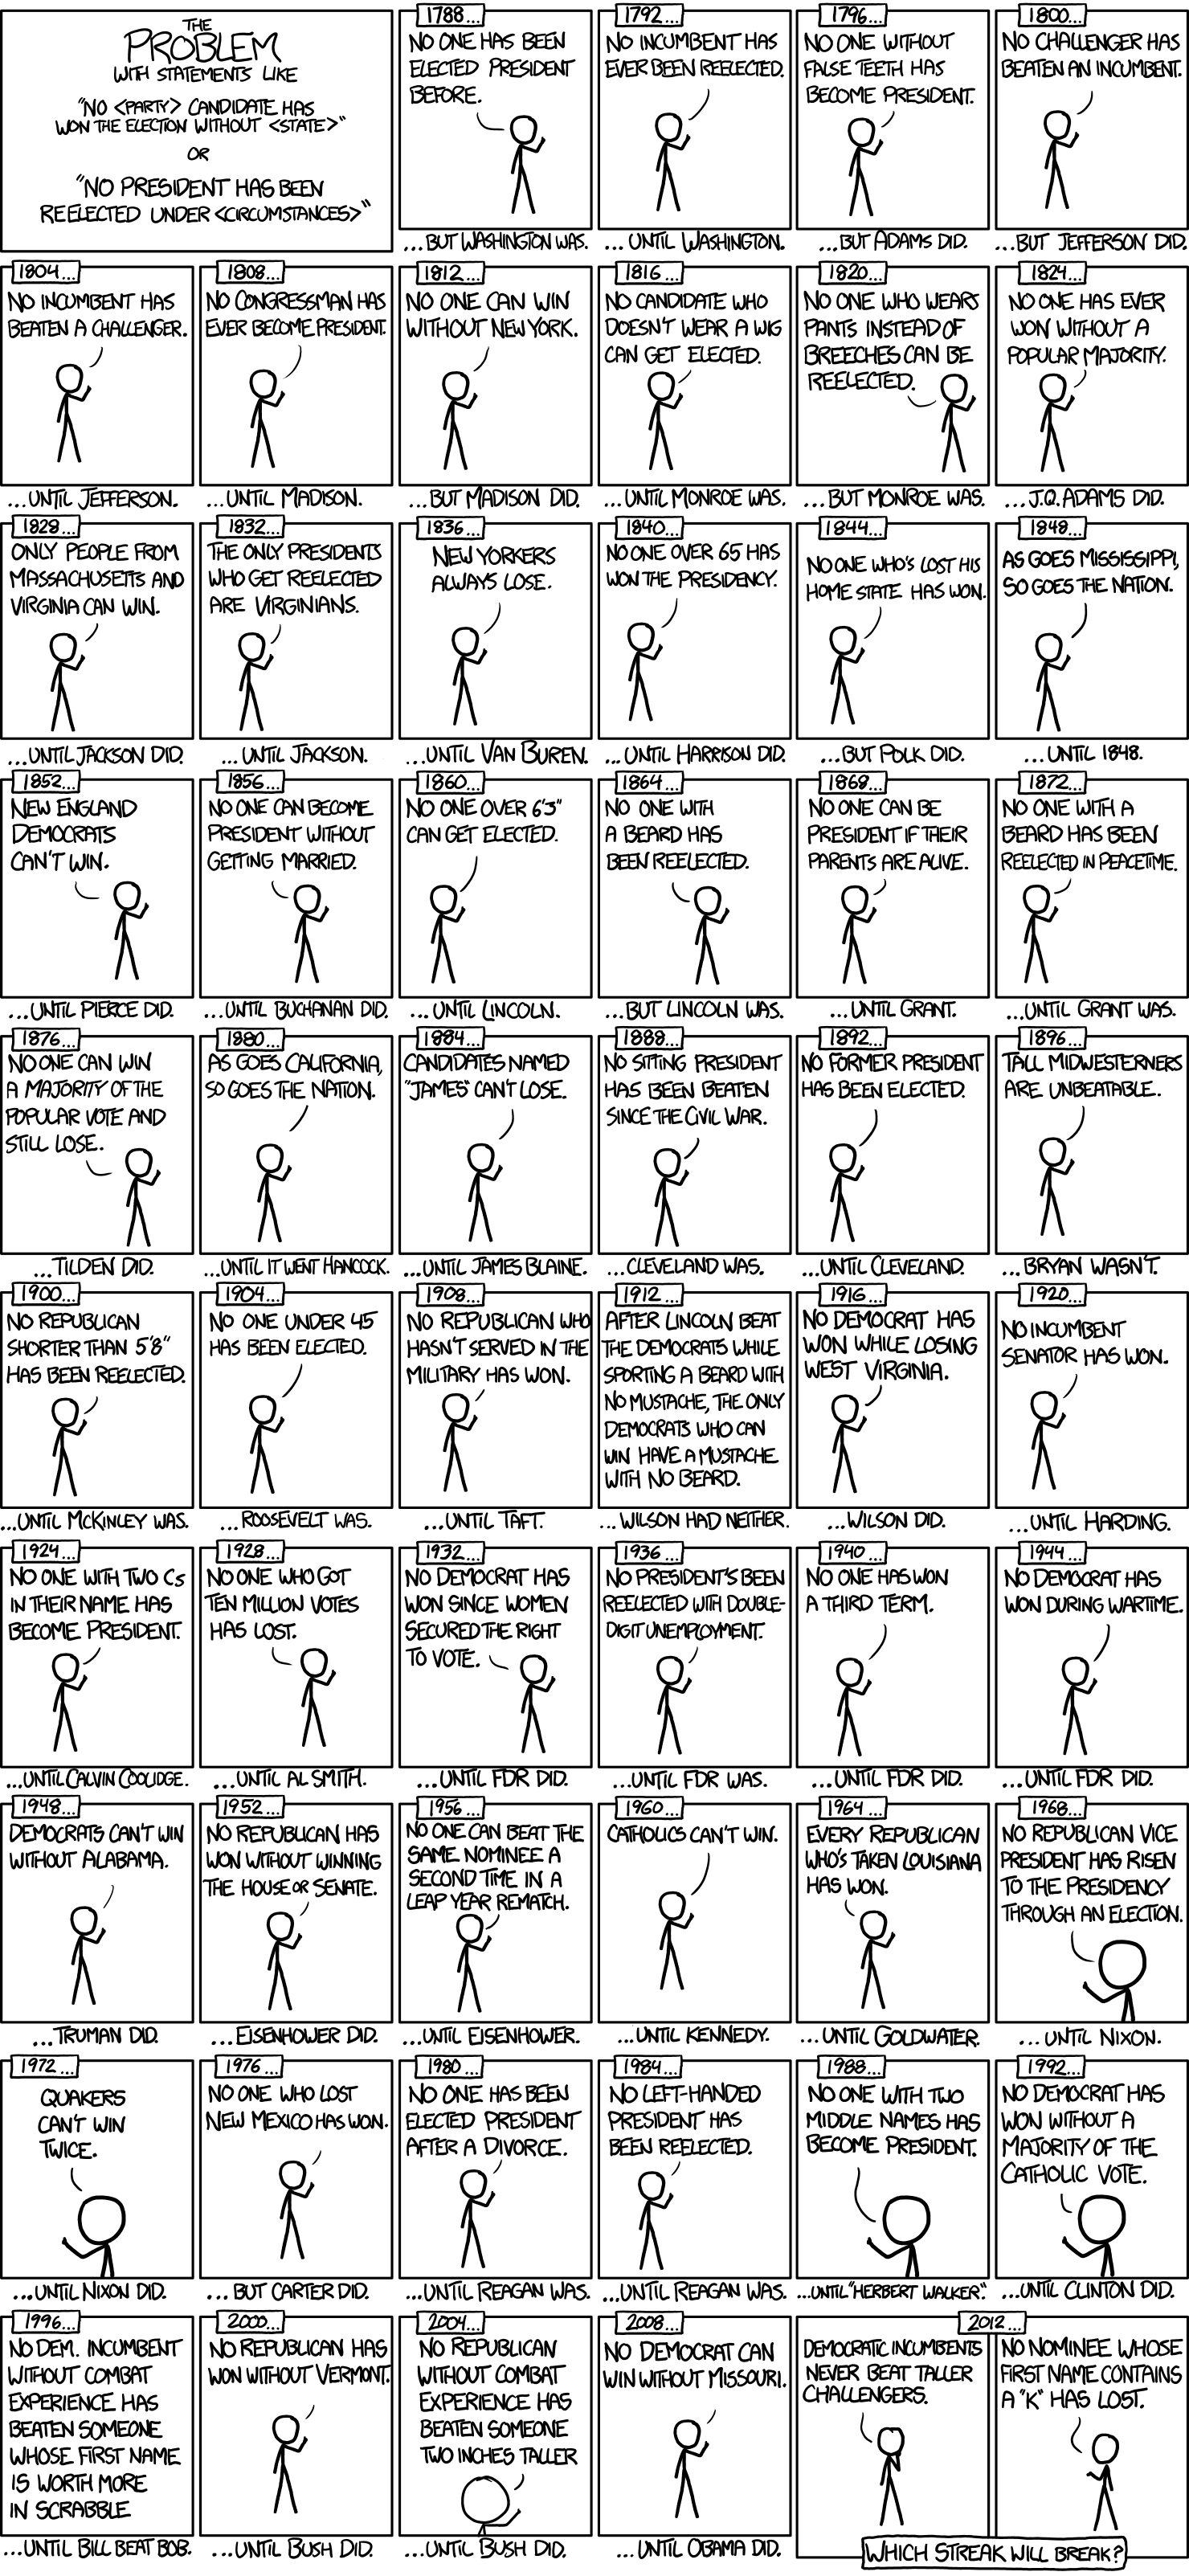
Consider this xkcd comic on “modeling” the outcomes of US presidential elections. How is this comic related to overfitting?
Check-in with groupmates
What ideas have you found confusing, less clear, or intriguing based on videos and class exercises? Based on this, what would help improve your understanding or help you improve others’ understanding? You’ll reflect on these noticings in the Metacognitive Reflection part of your homework assignments.