library(dagitty)
dag <- dagitty('
dag {
bb="0,0,1,1"
A [exposure,pos="0.264,0.498"]
IV [pos="0.115,0.294"]
U [latent,pos="0.456,0.220"]
Y [outcome,pos="0.657,0.494"]
A -> Y
IV -> A
U -> A
U -> Y
}
')
plot(dag)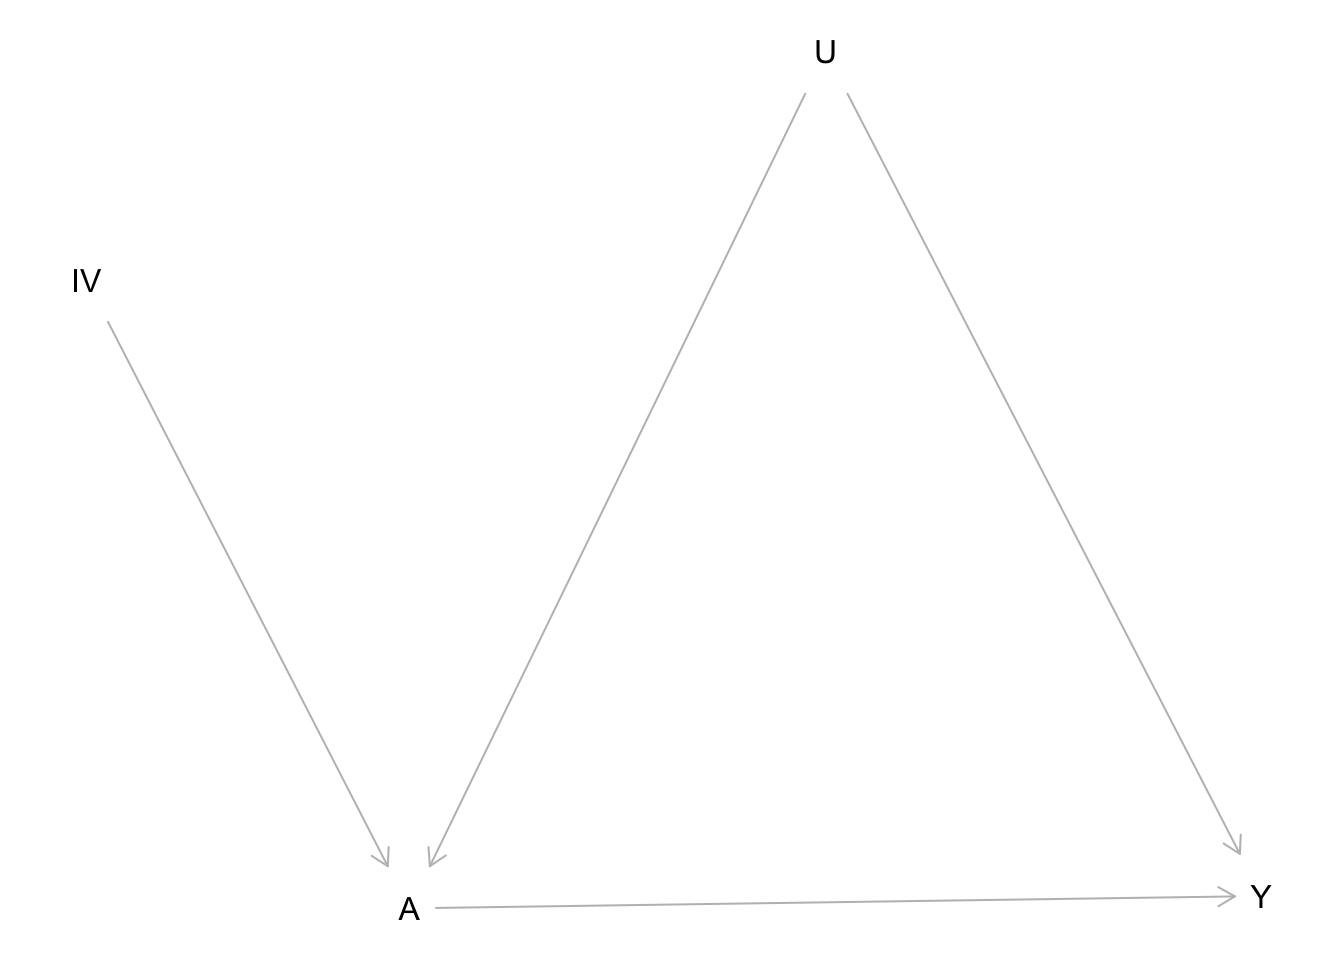
In health services research, the distance that one lives from a specialty care provider is often considered as an instrument. In particular, studies have looked at the causal effect of high-level vs low-level neonatal intensive care units (high vs. low level NICUs) on birth outcomes. (High vs. low is differentiated by the amount of technology available and number of babies delivered per year.)
The instrument used in this setting was a differential distance (excess travel time): travel time to the nearest high-level NICU minus travel time to the nearest low-level NICU. This instrument was binarized as follows:
Distance to these health services is known to be a reflection of where mothers live which, in turn, is often a reflection of socioeconomic status indicators.
Based on the context provided here, draw the underlying causal graph.
Based on your graph, identify a conditioning set such that the instrument would be valid.
Let’s consider if there might be other important variables missing from the graph.
Consider the following canonical causal graph for an IV design:
library(dagitty)
dag <- dagitty('
dag {
bb="0,0,1,1"
A [exposure,pos="0.264,0.498"]
IV [pos="0.115,0.294"]
U [latent,pos="0.456,0.220"]
Y [outcome,pos="0.657,0.494"]
A -> Y
IV -> A
U -> A
U -> Y
}
')
plot(dag)
Some analysts have believed that it is possible to perform a hypothesis test to test the exclusion restriction assumption with the regression Y ~ A + IV. Their rationale is that conditioning on A blocks the IV -> A -> Y path, and if IV and Y are still associated, there must be a direct path IV -> Y.
Explain why this reasoning is flawed.
While randomized experiments are the gold standard for causal inference when everything runs perfectly, noncompliance can be an issue. Noncompliance occurs when an individual does not comply with the treatment that was randomly assigned.
Draw a causal graph illustrating how the instrumental variables design can be applied in this situation.
In regression discontinuity designs (RDD), a sharp RDD is one in which being on one side of a cutoff results in a 100% chance of being treated. A fuzzy RDD is one in which the probability of treatment changes suddenly at the cutoff but not necessarily from 0 to 100%.
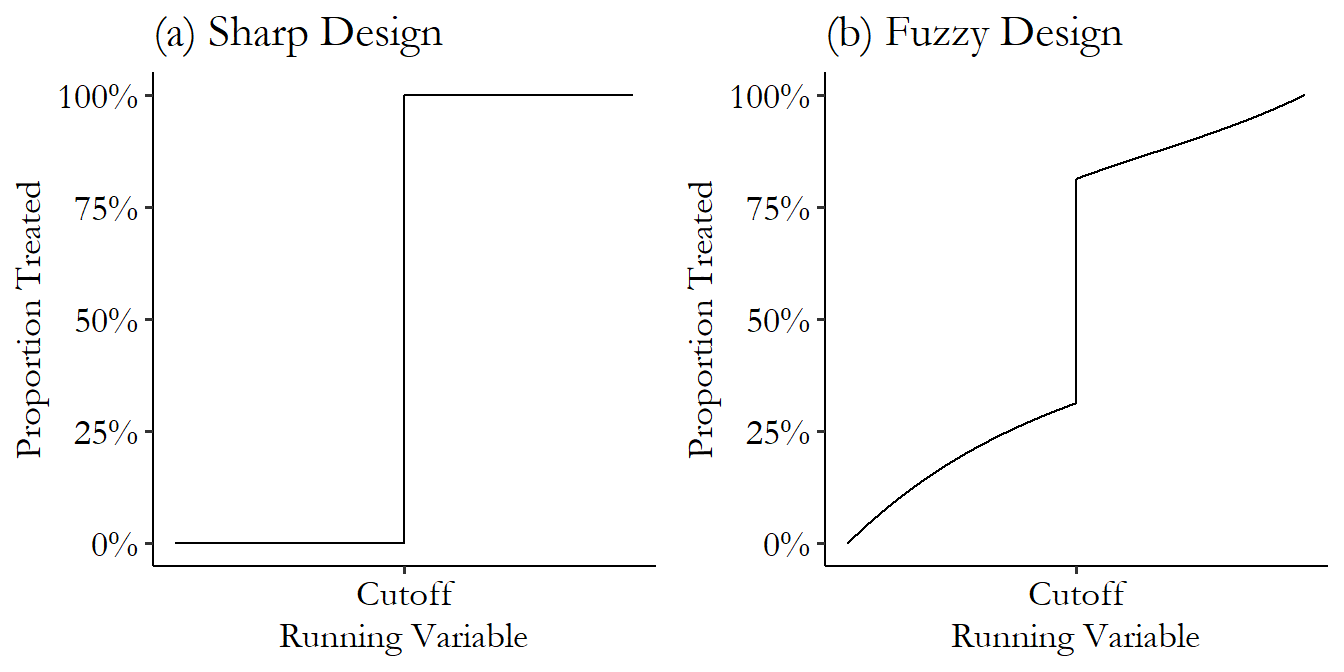
Draw a causal graph illustrating or explain in words how the instrumental variables design can be applied for analyzing fuzzy RDDs.
Could an instrumental variables approach be useful in your project setting? What might a potential instrument be?