Topic 17 Hierarchical Clustering: Part 1
17.1 Exercises
You can download a template RMarkdown file to start from here.
These exercises are for practice and are not part of your Homework 7.
To practice the hierarchical clustering algorithm, let’s look at a small example. Suppose we collect the following sepal width and sepal length measurements from 5 irises:
irises <- data.frame(
    Width = c(2.5,2.7,3.2,3.5,3.6),
    Length = c(5.5,6.0,4.5,5.0,4.7)
)
irises
## Width Length
## 1 2.5 5.5
## 2 2.7 6.0
## 3 3.2 4.5
## 4 3.5 5.0
## 5 3.6 4.7ggplot(irises, aes(x = Width, y = Length)) +
geom_point() +
geom_text(aes(label = c(1:5)), vjust = 1.5)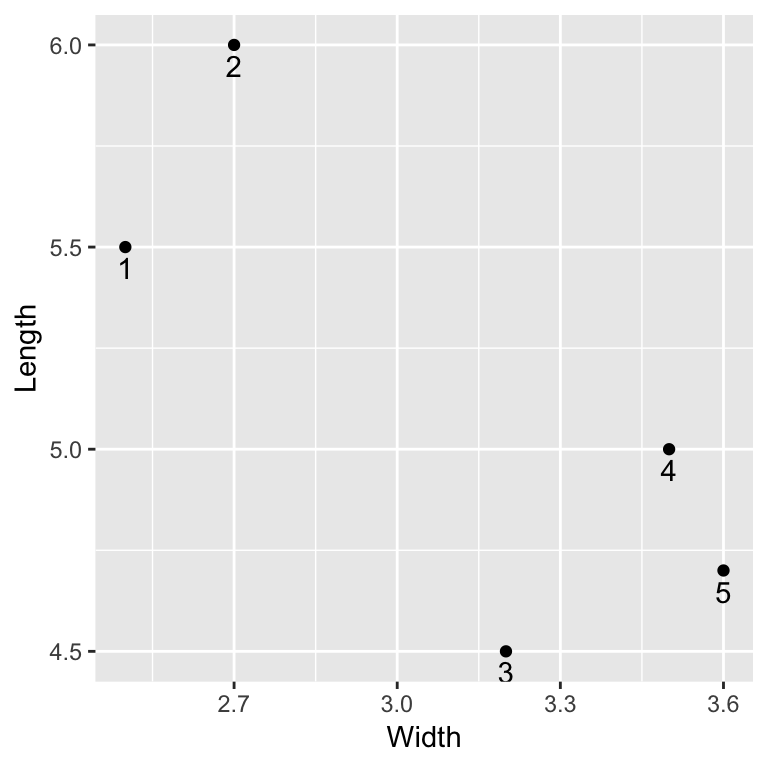
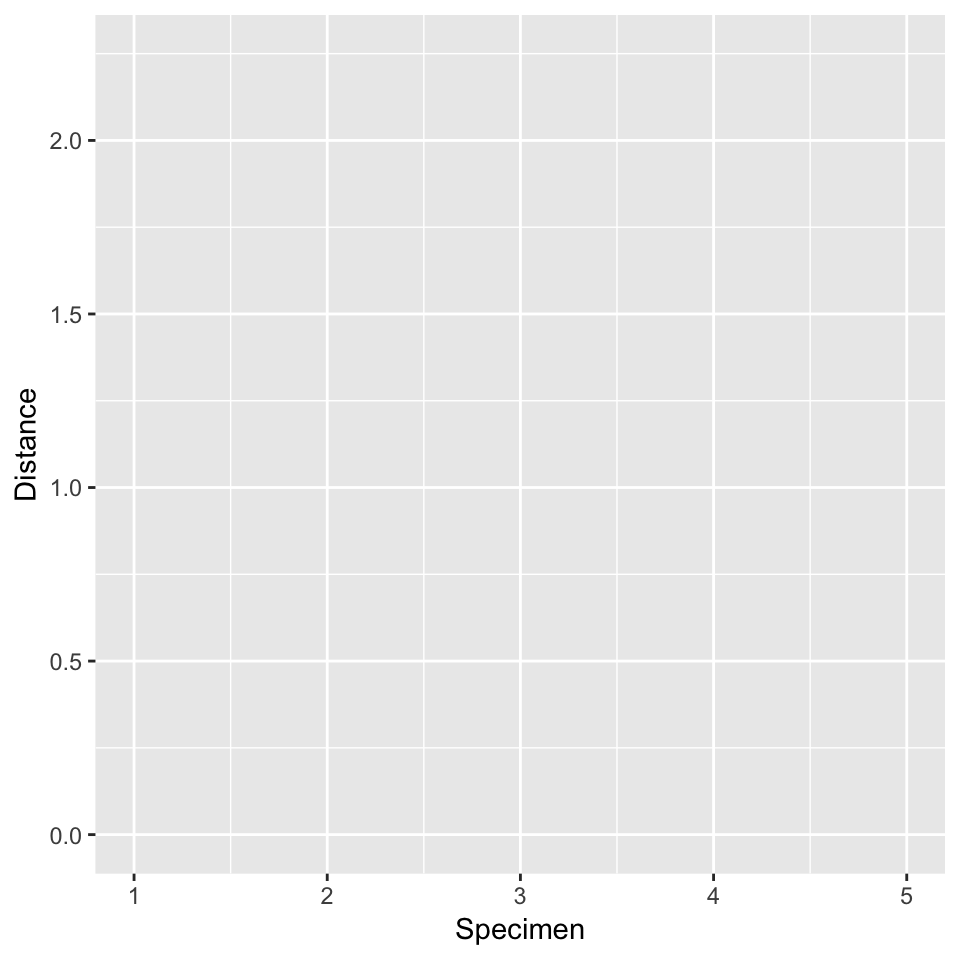
In the exercises below, you’ll draw a dendrogram for these 5 specimens by hand. Sketch the following plotting frame on some scrap paper:
- Step 1: First fusion
Calculate the distance between each pair of specimens:
dist(irises)The idea:
1 2 3 4 5 1 0 2 0 3 0 4 0 5 0 - Which pair of flowers 1-5 is most similar?
Draw the fusion between this pair of leaves on your plot. Be careful about the height at which you draw this fusion.
- Step 2: Second fusion
Construct a new distance matrix reflecting the distances between each pair of branches (where 4 and 5 have now been fused). Use complete linkage. That is, the distance between one branch and another is the maximum distance between any pair of leaves in those branches. The idea:
1 2 3 4 & 5 1 0 2 0 3 0 4 & 5 0 Which pair of branches is most similar? Draw the fusion between this pair on the plot.
- Step 3: Third fusion
- Repeat! Construct a new distance matrix reflecting the distances between each pair of branches, those that have been fused already and those that have not.
- Which pair of branches is most similar? Draw the fusion between this pair on the plot.
Step 4: Final fusion
At this point, you should have 2 specimens in one cluster and 3 in another. The final step is to combine these into the tree trunk. Draw this fusion.
Check your work in R:
iris_cluster <- hclust(dist(irises))
plot(iris_cluster)